Results
Pending Experimental Runs
This section will be populated after the evaluation harness completes benchmark runs across all 22 domains.
Macro-Average F1 Across 25 Domains
| System | F1 | EM | Tokens/q | RDS | CPCA ($) |
|---|---|---|---|---|---|
| RAG | --- | --- | --- | --- | --- |
| GraphRAG | --- | --- | --- | --- | --- |
| CKG | --- | --- | --- | --- | --- |
F1 by Query Type
| System | T1 | T2 | T3 | T4 | T5 |
|---|---|---|---|---|---|
| RAG | --- | --- | --- | --- | --- |
| GraphRAG | --- | --- | --- | --- | --- |
| CKG | --- | --- | --- | --- | --- |
Token Cost and RDS
Table 3: Token counts and RDS ratios --- pending.
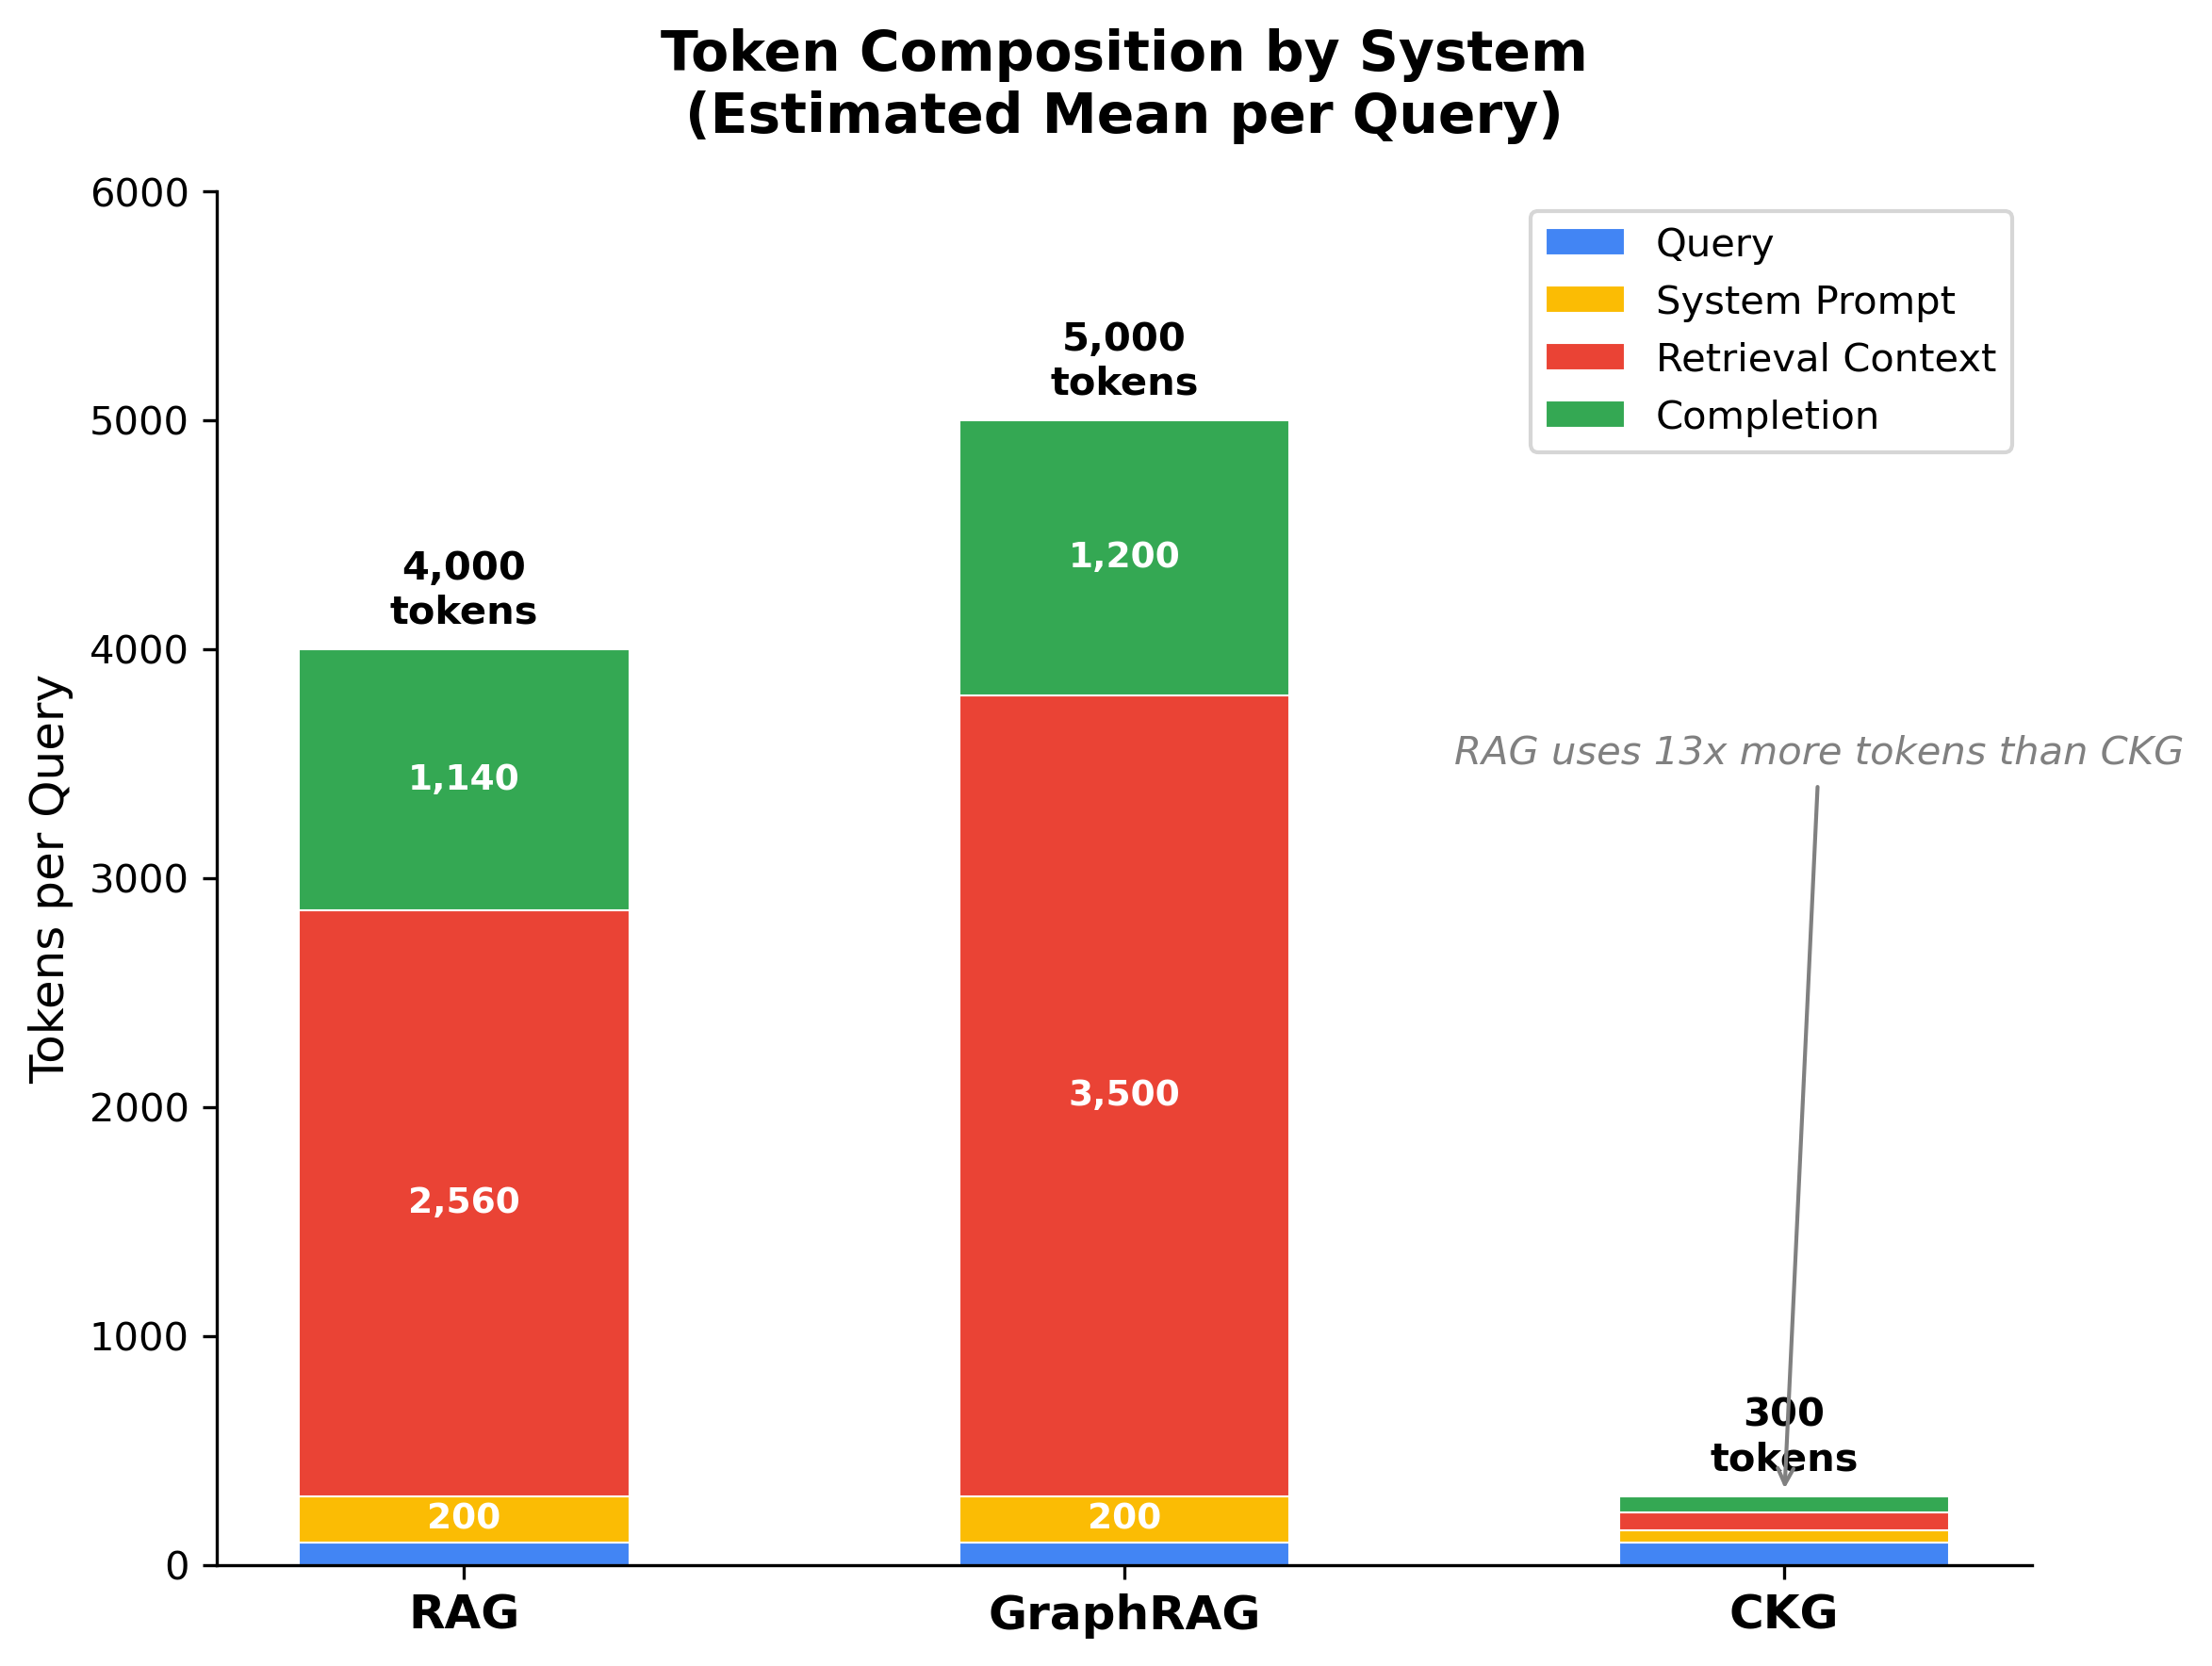
Figure 6: Token composition by system (estimated mean per query). RAG and GraphRAG consume 4,000--5,000 tokens per query, dominated by retrieval context. CKG uses only ~300 tokens---a 13x reduction vs RAG. Values will be updated with experimental measurements.
F1 by Hop Depth
Table 4: F1 at k=1,2,3,4,5+ for each system --- pending.
Figure 3: Hop-depth F1 degradation curves --- pending.
Structural Metrics
Table 5: RP, HNR, BC, HR for each system --- pending.
Efficiency Curves
Figure 1: F1 vs token budget curves (3 systems) --- pending.
Figure 2: RDS by domain scatter plot (25 points per system) --- pending.
Structure Premium Correlation
Figure 4: RDS ratio vs DAG richness with correlation coefficient --- pending.